JavaScript Logging: We can do better!
Currently in the world of JavaScript these options are what we most commonly use to generate logs:
console.logconsole.infoconsole.warnconsole.error
These are actually pretty good in most modern browsers. Even
if you go back to Internet Explorer 8 console.log and friends
work as long as you have the developer tools open.
Given that we have these logging utilities what is the problem with using them? When in local development these are just fine for helping debug and speed up development. They can be used to help you quickly catch errors or see where you’re starting to go astray when using a library.
console.log and friends allow you to see
what’s going on and leave notes for other developers in the
future. This is okay for local development. However, what do
you do once you move into production? Almost everyone removes
console commands before code is served in production.
Without console commands in production how do you have the same
level of logging you’re used to with standard applications?
When using a web server you get to see most every error that
occurs. Each 500 is logged to an error log file for every
error that occurs for every user. This is not something that
really exist for JavaScript. By the nature of how web browsers
work we do not get any errors that occur for the end user.
Here are the issues with JavaScript logging today:
- Local development is the only way to see the errors.
- Logs are distributed across many clients.
- Errors usually lack local stack context.
- We do not know when a user sees an error.
Given the problems listed above you may ask: “Why should I care?” We’ve gotten along for years without getting JavaScript errors. Try not to follow this line of flawed reasoning. Despite spending years without tracking analytics about how people use our sites, we now view those tracking analytics as invaluable. Once you start seeing your JavaScript errors at the same rate and volume as your server side errors you will view those logs as invaluable. Most importantly developers will finally be empowered to provide proactive fixes for JavaScript errors the same way we can fix server side errors in a proactive fashion.
Imagine this scenario, you have an advanced search feature in your application. This search feature works two fold: it has an AJAX call to fill out the search results as well as a two-layer UI with a drop down that shows the results. When a result is clicked, it opens a more detailed modal of those results.
In most cases this kind of interaction is JavaScript heavy. How do you know when the searches fail due to a scripting error, instead of a network drop on the client? What can you do to be proactive about issues occurring here?
We’ve released a logging framework, Canadarm, to make identifying and handling these kinds of situations easy. Now each time a script error occurs you’ll get to see it. As long as the client can connect to the Internet and execute JavaScript you’ll get to see what went wrong. A common issue you may not realize in local testing is a Unicode search error. This logger will tell you what error occurred as well as the language and encoding used to read your page.
Below are a some topics that are likely to cross your mind. This post will cover each of them in detail.
- What does Canadarm do?
- How does Canadarm work?
- Who has used Canadarm?
- Has Canadarm helped solve any problems?
- When can I use it?
This post will cover all of these questions in detail.
What does Canadarm do?
Canadarm makes it easy to send logs to a remote server.
This alone is nothing novel and isn’t all that impressive. It’s fairly easy
to setup a try/catch around your code and send that error to
a server via a GET request. The real advantage to Canadarm comes in
what it does to catch the errors.
Canadarm has three ways to gather errors:
- Automatically catch all
window.onerrorevents (least useful due to lack of context) - Automatically catch all errors that occur when events fire (most useful because it “just works”)
- Manually
watchorattemptindividual function calls
These modes allow you to write your code and not have to worry about logging or catching errors yourself. Any global errors will be caught and more specifically all errors bound to events will be caught. The ability to catch errors related to events is the most useful feature of Canadarm.
Most errors that will occur on your web pages happen when a user performs some sort of action. Canadarm is able to provide you with context specific error messages by automatically hooking into and monitoring functions bound to events.
With the Canadarm.watch and Canadarm.attempt functions, you have the power to individually
monitor specific functions. Let’s say you have a function that gets
called without an event being fired. You can call attempt on that function which
will immediately invoke the function. If an error occurs, the error will be logged.
With watch you can watch a function once and every time it
throws an error later during execution the error will be logged.
|
|
If you don’t want Canadarm to automatically log global errors
and/or event based errors you can opt-out of this feature. With
watch and attempt you can write your JavaScript how
you want to and not worry about what is going on within Canadarm.
Finally, you get out of Canadarm what you really wanted from console functions.
You can log specific error messages at the point you want to via
these logging commands:
Canadarm.debug(msg, error)Canadarm.info(msg, error)Canadarm.warn(msg, error)Canadarm.error(msg, error)Canadarm.fatal(msg, error)
Optionally, you can provide two more arguments after msg and error. data
followed by options. You can see the usage of these arguments over in the
Canadarm documentation. Specifically, data is the most useful
here. data allows you to pass an extra object that will get its values passed
to the appenders. The default appender included in Canadarm will log all these
values for you as key-value pairs.
|
|
To find out more on how to configure and use Canadarm go and check out its documentation. It’s pretty easy though. You only need to include the Canadarm code and then configure the logger. As seen on the Canadarm readme, you can do the following to get a working local logger:
|
|
Now you’ll see all logged errors in your console with all the information the standardLogAppender provides. Obviously you want more than local logs. Next you’ll see how our teams have used this logger.
How does this work?
Canadarm is fairly simple. The logger catches an error and then sends that error to a central server. Under the covers it uses Appenders and Handlers as the mechanisms to achieve this result.
Appenders
An appender works as a way to process an error or log event that occurs.
The appender has this signature: appender(level, exception, message, data).
level- Level of the log, one ofDEBUG,INFO,WARN,ERROR,FATALexception- An actual JavaScriptErrorobject.message- Text message of the logged error.data- Extra information to provide to the appender, usually this is not used.
An appender must return an object. The object should contain simple data types. They are single key/value pairs, usually strings. The return value of an appender is then passed to a handler.
Handlers
Handlers take action on the objects produces by the appenders. A handler’s job is to send the results of the appenders somewhere. By default there are two handlers that come out of the box with Canadarm: a console handler that logs all errors to the console and a beacon handler that sends all errors to a given URL end point.
Appenders & Handlers
Appenders and handlers work together to create your logs. Here’s the break down of what happens during an error or logging event:
- Error or log event happens
- Every appender is iterated over in order (duplicate keys will be replaced with the value of a later appender)
- A final object is created from the output of all appenders
- The final object is passed to every handler
- Each handler usually sends this information somewhere (e.g. console or remote server)
That’s it for how the logger works on the client. The real power comes when you combine this log gathering with the BeaconHandler. The logs gathered are then sent to a server. The server receiving these logs should be writing them out to a file that is then read into a logging system. We currently use a simple Apache server and treat its access logs as our JavaScript error logs. We then send the logs to a log aggregation tool, Splunk.
Who has used it?
We have a few applications that have begun using Canadarm.
- HealtheLife - website for patients to manage their health
- Internal Sites - a few sites we use internally for a few things (e.g. code review, cheat sheets etc.)
HealtheLife
HealtheLife was the first client facing application to go into production using Canadarm. They have over 3 million users and at any given moment they usually have at least one thousand concurrent users. These metrics matter for two reasons: first, it shows us that Canadarm works at scale without causing issues to the application, second, we have been able to see trends in JavaScript errors occurring in this application.
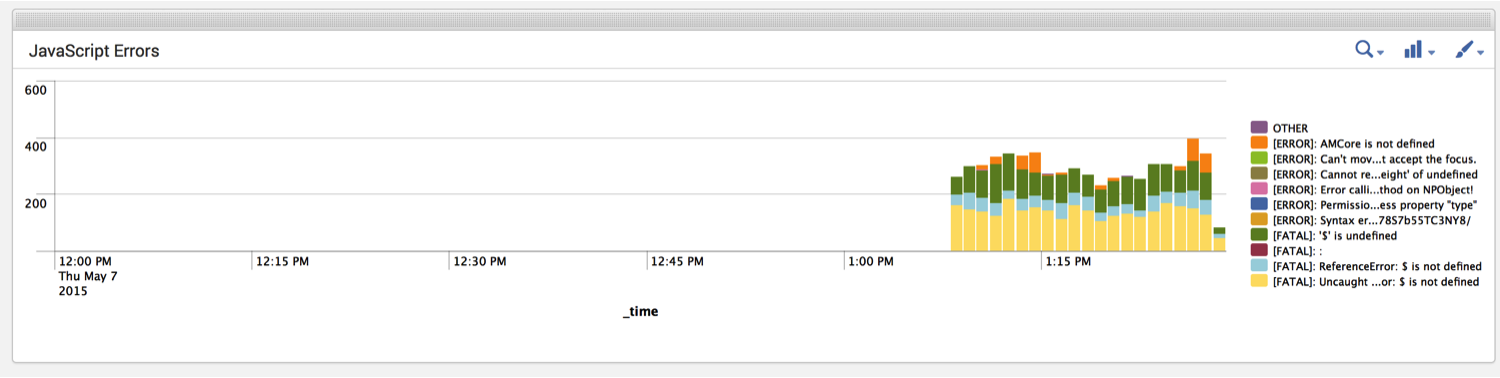
For those who thought “why should I care?” when it comes to JavaScript logs
this go live was an interesting story. Within the first 20 minutes we
noticed errors that occurred on every page load. Specifically this error
was a reference to $ (jQuery) before it was defined. Since this was in
an analytics tracking snippet, and at the end of a script tag, it did not
cause an end user impact, beyond eating processing time to handle an
error on every page.
However, it did mean that analytics were not getting tracked how the application intended. In fact, without this logger in place the application would have happily continued along with no indication certain actions where never taking place. Since the analytics tool did not report the expected user interactions, it appeared as if features of the application where not getting used, or worse, that the analytics were faulty.
The actual messages in the errors for this application are interesting. Since HealtheLife is used in many countries with many different locales, they support various languages. Because of the various supported languages and users being able to use their browsers in any locale they want, we had a few interesting logs messages. Specifically we have had a few logs come across in English, Spanish, German and more. It was kind of eye opening to know that errors are actually translated within a browser.
Internal Sites
Currently a few internal sites are using Canadarm for local development and integration environments. Most interesting so far for has been looking at the logs and seeing who has been copy pasting code around.
Interestingly enough I found some random logs on our Splunk dashboard in dev.

Which lead me to github, specifically a github pages site.

Seeing the application and where the logs said the application lived I was able to find the source code. The code then lead me to the owner of the application. At that point I was able to contact the owner and get the issue fixed. Finding another application’s errors and letting the owner know about is an interesting experience. The whole interaction was cool because it was not a use case we had considered when building Canadarm.
Has it helped solve any problems?
As mentioned before this has helped to point out two issues: one for HealtheLife and another for an internal application. Pointing out issues is not enough to fix them though. Also, Canadarm does not solve problems on its own. You get the most out of logging when you use a tool to aggregate those logs. We’ve been using Splunk to aggregate our logs.
Combined with the searching and reporting of Splunk we’ve been able to leverage the logs generated by Canadarm to see a few common trends in our code. Canadarm has helped us to see a few common problems we have:
- Locally we produce a lot of JavaScript errors
- We often introduce new errors when we write visualizations
- Referencing variables before they exist
- New frameworks are hard to get a handle on
Using Canadarm to generate logs doesn’t solve problems on its own. It’s when we combine those logs with the reporting capabilities of Splunk that we can see trends and identify areas we need to improve upon in our development.
On our teams it has shown that we need to get better at defining our APIs for data visualizations. I’ve been able to see many errors from our developers when they first try to update or modify any of our visualizations. Without this logging in place it would not be so obvious that our current API is not working well for others. This gives us empirical data that developers are having issues using our software. Without this data, we’d have to rely on complaints and hope people reported the issues they encountered when using our code.
As a more concrete example, recently one of our teams has begun to try and use react. By analyzing the logs it’s easy to see that we have had some issues getting a handle on how react works. Over the few weeks of react work we could clearly see a number of errors. This shows we need a lot more training on how to properly use react. Further it shows me that if we plan to adopt react as our frontend framework that we need to put together a “gotcha” or “tips and tricks” guide for getting started.
While the logger is not directly “solving” problems it is helping to illuminate issues we are seeing in local development as well as in production. By shining a light on these issues we are able to move forward and solve these problems ourselves. Sometimes the problems may be solved by additional training or they may be solved by code changes. Most importantly Canadarm is opening our eyes to the kinds of issues we’ve had for years with JavaScript. We can no longer ignore these issue because we have solid empirical evidence showing us our problems.
When can I use it?
After reading along this far hopefully you’re thinking: “This all sounds great! When and how can I get started?”. It’s pretty easy:
- Include Canadarm in your JavaScript (as early as possible)
- Configure Canadarm
- Have a server to handle logs
- Have a reporting tool on top of your logs
Standalone applications
If you are a public facing Internet application or a small startup, Canadarm can still be a great investment. Ideally you do not need to worry about steps 3 and 4 above. Simple Log management solutions, such as Loggly should be enough for your needs.
Here’s what I did to get a quick setup working:
- Setup a free account
- Fill out info in the pop up
- Go to
https://YOUR_SUB_DOMAIN_HERE.loggly.com/sources/setup/https - See the “step 2” section you should have a URL to copy that looks something like:
http://logs-01.loggly.com/inputs/WWWWWWW-55555-5555555-55WW55-WWWWW55555/tag/http/ 5. Configure Canadarm with this end point to see the logs:
Canadarm.init({
  onError: true,
  wrapEvents: true,
  appenders: [
    Canadarm.Appender.standardLogAppender
  ],
  handlers: [
    Canadarm.Handler.beaconLogHandler('http://logs-01.loggly.com/inputs/WWWWWWW-55555-5555555-55WW55-WWWWW55555/tag/http/'),
    Canadarm.Handler.consoleLogHandler
  ]
});
After this setup it was pretty easy to get some graphs going. For example you can easily see what errors occurred by message in this pie chart:

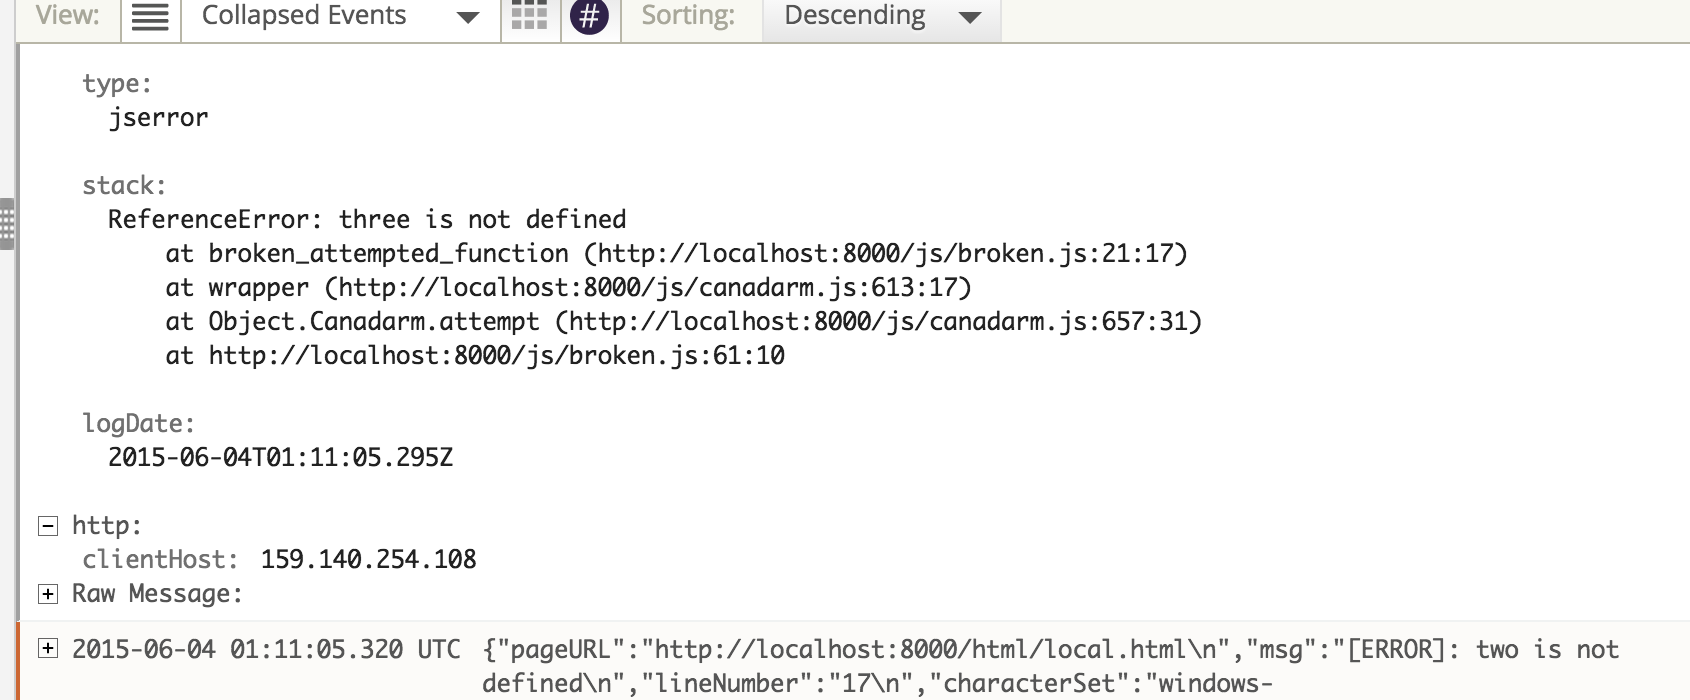
Even easier is getting to view the raw output of a given event message:
Loggly is a great tool to use for large and small projects. A big bonus for anyone starting to use Loggly for their JavaScript logs it that they can begin to use Loggly for their other logs (if they are not already). While Loggly may not be ideal for every situation when it comes to logging, it is really handy when you do not have the resources, money, or time to setup your own log aggregation tool.
Summary
From desktop, to mobile, to embedded devices, web browsers can be seen everywhere. With the help of Canadarm we can now see what exactly is happening within our applications. An entire world of client side errors and issues can now be properly managed and acted upon. Combine these logs with an aggregation tool such as Splunk or Loggly and you have enabled operational intelligence.
The next time a user logs an issue for a JavaScript error you can respond by telling them you’ve seen the error and are already working to correct it. Gone are the days of reactive fixes. Now you can worry about proactive solutions.