Difficult Debugging: Learning From Utter Nonsense
Preface
As software engineers we invest time into thinking about the problems we are trying to solve every day. Sometimes the problems we face are small or simple. Other times they are large and complex. Either way, we can usually draw from our experience to find a path forward.
While coding, we run into a lot of different bugs. Often, they are simple typos or a misuse of an API. These problems do not bog us down very much, and they are quick and easy to fix. Even complex bugs, while requiring investigation, often follow a familiar pattern(s) that help us identify a path to a solution.
Given this experience, it’s easy for us to think that we are good at debugging.
We are not. We are good at pattern recognition and recognizing similarities to problems we’ve faced in the past. Because we recognize the pattern, we can quickly debug most of the bugs we come across in our day-to-day work.
Which is great. But today, we will be exploring the types of bugs that do not come up in our day-to-day work.
How Bugs Can Mislead Investigative Efforts
When a bug is brand new to us, we haven’t had the opportunity to derive a pattern from it yet because we have no experience to draw upon to create that pattern(s). Thus, we must investigate using a limited set of tools:
- Error messages
- Stack traces
- Guessing and check debugging
- Colleagues
Often enough, that set of tools will guide you to a solution within a reasonable amount of time. Be warned, sometimes the solutions online solve a similar problem, but not your root problem. Testing is always in order with new bugs (or any bug more complex than a typo).
Debugging gets even trickier and more time consuming when we encounter a bug that resembles a pattern that we’ve seen before. Once, I came across a bug which looked like two other things, but turned out to be a third unexpected thing.
Treemaps and IE8, and Fonts, Oh My
One of our teams created an interactive DOM based treemap which worked in Internet Explorer 8 (IE8) and above. It wasn’t lightning fast in IE8, but it worked sufficiently well with a reasonably complex dataset. That is until the browser started crashing intermittently for some of our users.

There were a few things that we (four engineers) noticed right away:
- It only crashed in IE8
- The presence of a treemap seemed to be a driving factor
- Crashing was intermittent
Our initial investigation was good. We isolated the problem browser and determined that there was something wrong with the treemap, which was causing the issues, we were on our way to solving this problem - or so we thought.
Given the intermittent nature of the problem, our experiences in the past, and the patterns we had observed, we assumed we had a memory leak, a race condition, or both. In an attempt to rule one of those options out, we tested with small and large datasets for the treemap.

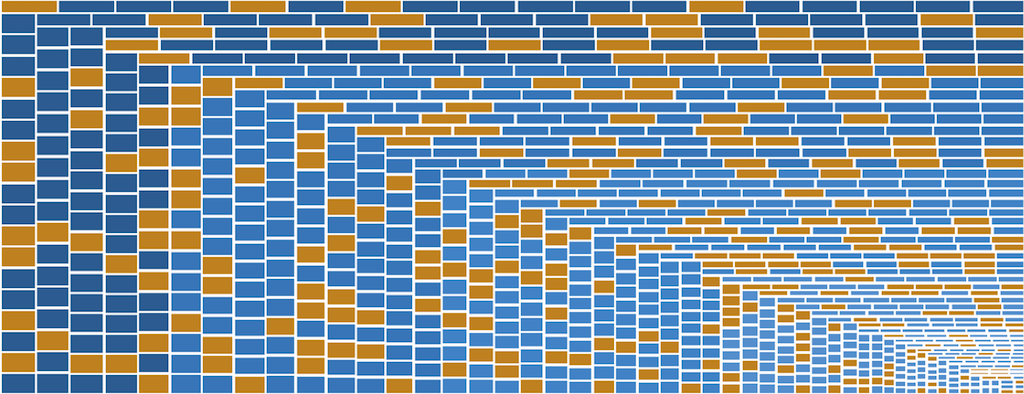
The above image serves as proof that modern browsers were unaffected by the bug we were experiencing.
Convinced that the treemap was the issue and that it had to be a memory leak or a race condition, we created automated tooling using sIEve, virtual machines, and AutoIt scripts. The automation enabled us to test dozens of scenarios hundreds of times easily to gain metrics which might help illuminate where, in the code, we should look next.
We chose different sized datasets thinking that smaller datasets would not trigger a memory leak while a large one would. Unfortunately, it crashed either way and we were no closer to figuring out what was wrong.
After several more days of investigation we were just as perplexed as the day we started. We had a plethora of information which told us nothing. At this point our capacity had to be reduced down to just one developer - me. Frustrated with the resultless weeks spent investigating the issue, I decided step back and take a completely different approach.
To re-evaluate everything we did, I removed all of the assets from our application to minimize moving parts; regardless of how unlikely a variable was, I wanted to remove it. I ran our test scripts against the application to find that, unsurprisingly, the browser did not crash. I then added JS and CSS assets separately to find that neither alone caused the browser to crash. As a sanity check, I added both back to the application and it would reliably crash. This implied that there was some interplay between CSS and JS which was causing the browser to crash.
In our application, it was easier to add CSS file by file than it was for JS so I went that route. Along the way, I noticed that we were sending the wrong X-UA meta tag so I got sidetracked and fixed that to no avail. Eventually, I added back our Font Awesome CSS which caused the browser to crash. Thinking there was no way that a font could be the issue, I added and removed various pieces of our CSS to determine if it was the cause of the problem. I tried changing selectors, changing the load order, and everything else I could think of to no avail. After a while, frustrated, I commented out every line referencing Font Awesome and the browser stopped crashing. At this point, I just started adding code back line by line until the browser started crashing. What I found made no sense:
&:before {
  font-family: 'FontAwesome';
}
I looked over this for a while and eventually noticed that we were using single quotes when we referenced the font while the font declaration
@font-face {
  font-family: "FontAwesome";
  src: url(@fontAwesomeEotPath);
  font-weight: normal;
  font-style: normal;
}
was using double quotes.
Having exhausted most other options already, I tried making the quotes match to see if the browser would crash and, to my surprise, it wouldn’t. It didn’t matter whether I used double or single quotes as long as they matched. I added back all of the remaining assets and tested this again; sure enough, the app did not crash even after 200 tests.
Yes, it’s true. It wasn’t a race condition or a memory leak within the treemap, or anything else we thought it might be. It was mismatched quotes. I would never have guessed this in a million years.
I did not stop here! Although I solved the problem, I needed to understand what was going on. I was also very curious which part of the JS was causing issues with Font Awesome. I reintroduced the old CSS and started testing the JavaScript. The application broke as soon as I re-introduced Modernizr. The treemap was, at this point, seemingly faultless as I was able to reproduce the crashes without it.
I researched mismatched quotes and Modernizr online to try and get a better understanding of what was going on. I found several articles that detailed similar issues, but did not identify the root cause. Eventually I found a post on StackOverflow that enabled me to connect the dots.
Browsers do a lot for developers under the hood and IE8 treats different types of quotes differently and kicks off an error handling subroutine to smooth it over. If that error handling subroutine occurs while Modernizr is attempting to shim the browser for HTML5 compatibility, the browser will crash.
We weren’t wrong in that we were facing a race condition, but we were very wrong about our presumption about the treemap. The only interplay the treemap had was that it caused Modernizr to take longer to apply the shim thus widening the window of opportunity for the race condition to apply.
We worked on this from December 20th to January 9th, a total of twenty days!

How To Tackle Perplexing Bugs
Oftentimes, our ability to recognize coding patterns enables us to identify and solve bugs in a timely manner. As the example bug shows, however, following them can lead you down a rabbit hole. At face value, twenty days were spent working on that bug, but when you consider that there were up to four developers involved at a time, the lost time actually equates to one to three months. Once you factor in opportunity cost on top of that, you look at two to six months of time lost to debugging this issue.
That is a disturbingly significant amount of time to have lost on a bug. It was a difficult bug to solve, but it could have been solved faster had we recognized that our past experience was insufficient to solve this problem. There are some key points to take away from debugging something perplexing like the example bug we looked at:
- Isolate the problem. Find a single way that the bug can be consistently replicated and remove any variance that can trip you up.
- Automate as much as you can. There are likely to be many tests; let the computer handle that work for you. While working on the example bug, we ran thousands of tests over those twenty days.
- Remove as many variables as possible and keep a list of what’s remaining.
- Change one variable at a time. If you change many things simultaneously, you won’t know what yielded which results.
- Test, document, and repeat. When you change a single variable, record all of your findings. How did the results change? Eventually new patterns will present themselves.
- Narrow the scope. As your testing reveals patterns, narrow down to a smaller area. In the example bug, we went from “somewhere in our static assets” to “something in our CSS and JS” to “something in this particular file” to “it’s this particular line”.
- Repeat and keep repeating. Be meticulous in recording your findings. Even if you don’t see a pattern, someone else studying your results might.
When you find that past experience is not yielding results in a timely manner (you’ll have to define what that means for yourself), take a step back and follow the steps above. Doing this allows your past experience to help you when it applies and gets it out of the way when it doesn’t. Don’t see how far the rabbit hole goes when you can scientifically figure it out.
Additionally, do not blindly trust answers found online. When working on the example bug, we found several examples of people correctly identifying a similar problems to ours, none of which correctly identified the underlying cause. Treat online resources as what they are - resources. Sometimes they have the answer you seek while other times they are the dots you must connect yourself.
Tools and Techniques Which Will Help With Day-to-Day Developing and Debugging
Linters
Static analysis, or linting, is a technique to catch common coding mistakes quickly. A linter will evaluate raw source code and give back a report detailing what needs to be fixed. Most languages have some form of linting software available for them. Since this post is front-end oriented, below are a few linters available for JS:
All of these tools will notify you when you make typos, aren’t using variables, fail to follow a predefined set of coding styles, and more. They are very fast and are your first line of defense against day-to-day bugs. Linters will catch mistakes much faster than a human.
Example
I have a friend who is a very talented software engineer and mathematician. One day he called me to see if I could help him debug an issue he had been struggling with for about 19 hours. His Angular application kept spin locking (freezing up) and he couldn’t figure out why. We scrolled through the code and luckily for him, a piece of it caught my eye:
for (var i = 0; i < 10; i++) {
  for (var i = 0; i < 5; i++) {
    // logic
  }
}
He had been working on C++ code prior to this project which features block scoping while JavaScript (ES5) only features function scoping. A linter would have immediately caught this mistake and informed him of it, saving 19 hours of debugging.

Automated Testing Frameworks
While static analysis is your first line of defense, tests for your code are your second line of defense. Tests should depict the behavior of your codebase and should fail if you deviate from that contract. Just like linters, most languages support automated testing. There are several frameworks that you can leverage for testing JS, a few are:
Defining a set of behaviors for your code helps to protect you from unintentional changes and side effects. Tests will take longer to run than a linter, but are still frequently quicker at catching mistakes than a human. Since automated unit tests are like a contract for behavior, they can also help keep developers unfamiliar with the behavioral contract from making mistakes.
Debugging Tools
When automated approaches are insufficient, it’s time to start the manual debugging process. Every programming language has a debugging toolset that can be used to work through code with bugs. Since this post is front-end oriented, we’ll look at browser tools.
You could use JS to alert variables at different times, but this is radically inefficient. Today’s modern browsers have a plethora of tools available to you starting with the debugger keyword for JS code. When the browser’s console is open, the debugger statement acts as a breakpoint; it does nothing otherwise. Although simple, it’s very powerful as it gives easy control of adding/removing breakpoints to step through the code.
Atop the debugger keyword lay all of the browser tools. These enable you to step through code, inspect code, profile code runtimes, inject assertions, and even monitor the network traffic relating to the current page. Different browsers have different tools; below are some guides for debugging in different browsers:
Automated Robustness Testing
When you are in the process of manually debugging code, it is useful to automate what you can. For example, when testing the IE8 crashes, we used virtual machines and an AutoIt script to recreate and test the scenario as well as to keep logs of what happened for future reference.
Whenever possible, always automate recreating the scenario(s) for testing purposes as it:
- Speeds up the process
- Removes human error
- Ensures consistently gathered metrics
Conclusion
Many bugs will follow the pattern(s) of another bug and this can help you debug them quickly. However, this is not always the case; tools and automated tests will help you speed up your debugging time, but cannot keep you from chasing ghosts.
Remember, the following steps are the key to solving difficult bugs without losing a lot of time and effort:
- Isolate the problem
- Automate
- Remove as many variables as possible
- Change one variable at a time
- Test, document, and repeat
- Narrow the scope
- Repeat
When faced with a challenging bug watch how much time and effort you give to it. When it’s time to step back and re-evaluate your approach, do so and success will follow.