Managing 30,000 Logging Events per Day with Splunk
Our team works on a patient facing web application with a thousand live clients with 2,315,000+ users. On an average, the high traffic results into more than 40,000 visits and 300,000 page views daily generating about 30,000 logging events. A considerable portion of these events are of information and warning level in order to aid proactive monitoring or identify potential issues due to clients’ misconfiguration.
Before Splunk
To handle this large volume of logging, our team created a rotational support role to manually monitor the logs at regular intervals daily. We built a custom log viewer that would aggregate application logs and the engineer on the support role was expected to watch this tool manually to identify issues. Although we were able to identify problems such as bad client builds or service errors, it was not very efficient nor accurate in quickly determining end user impact stats. Since there was no way to tag previously identified and resolved issues, often times newer support engineers lacked knowledge to react to a problem. This led to unnecessary escalation and engagement of next tier support.
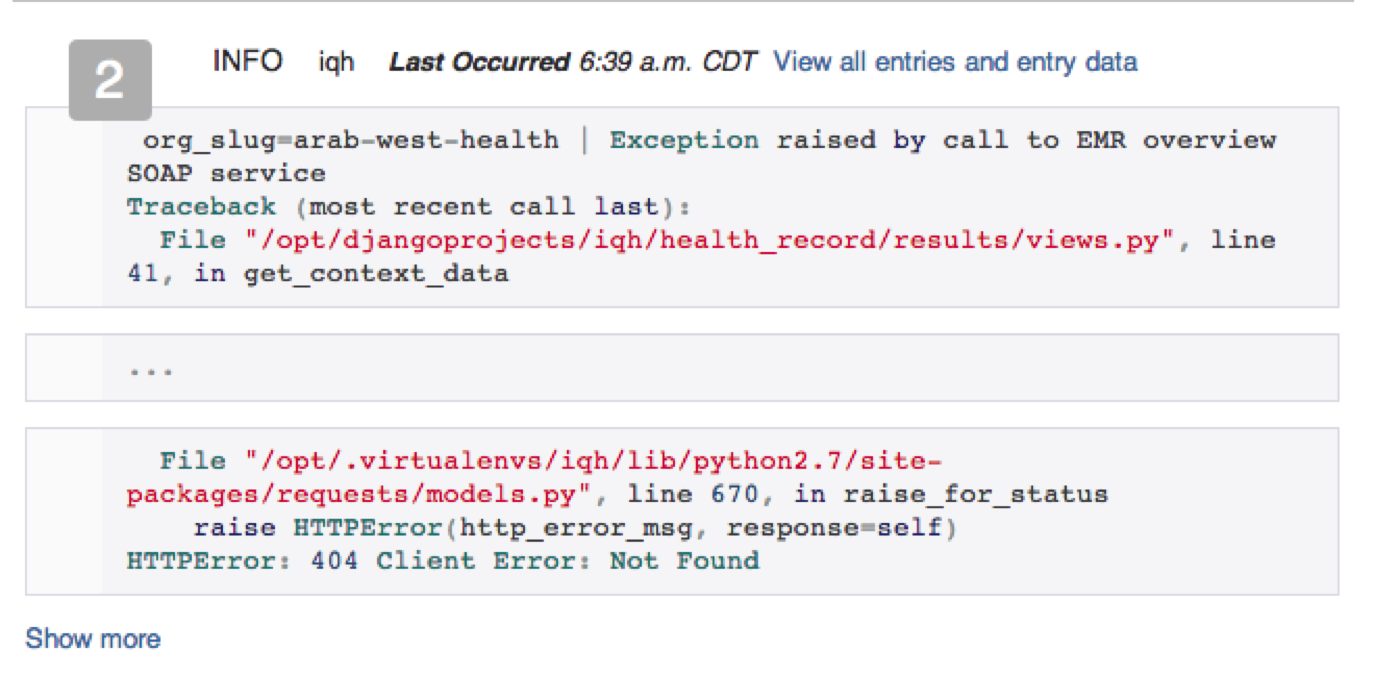
Below: Our old log aggregator used to identify the occurrences (2) of a log with the stack trace.
Splunk Round 1
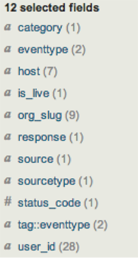
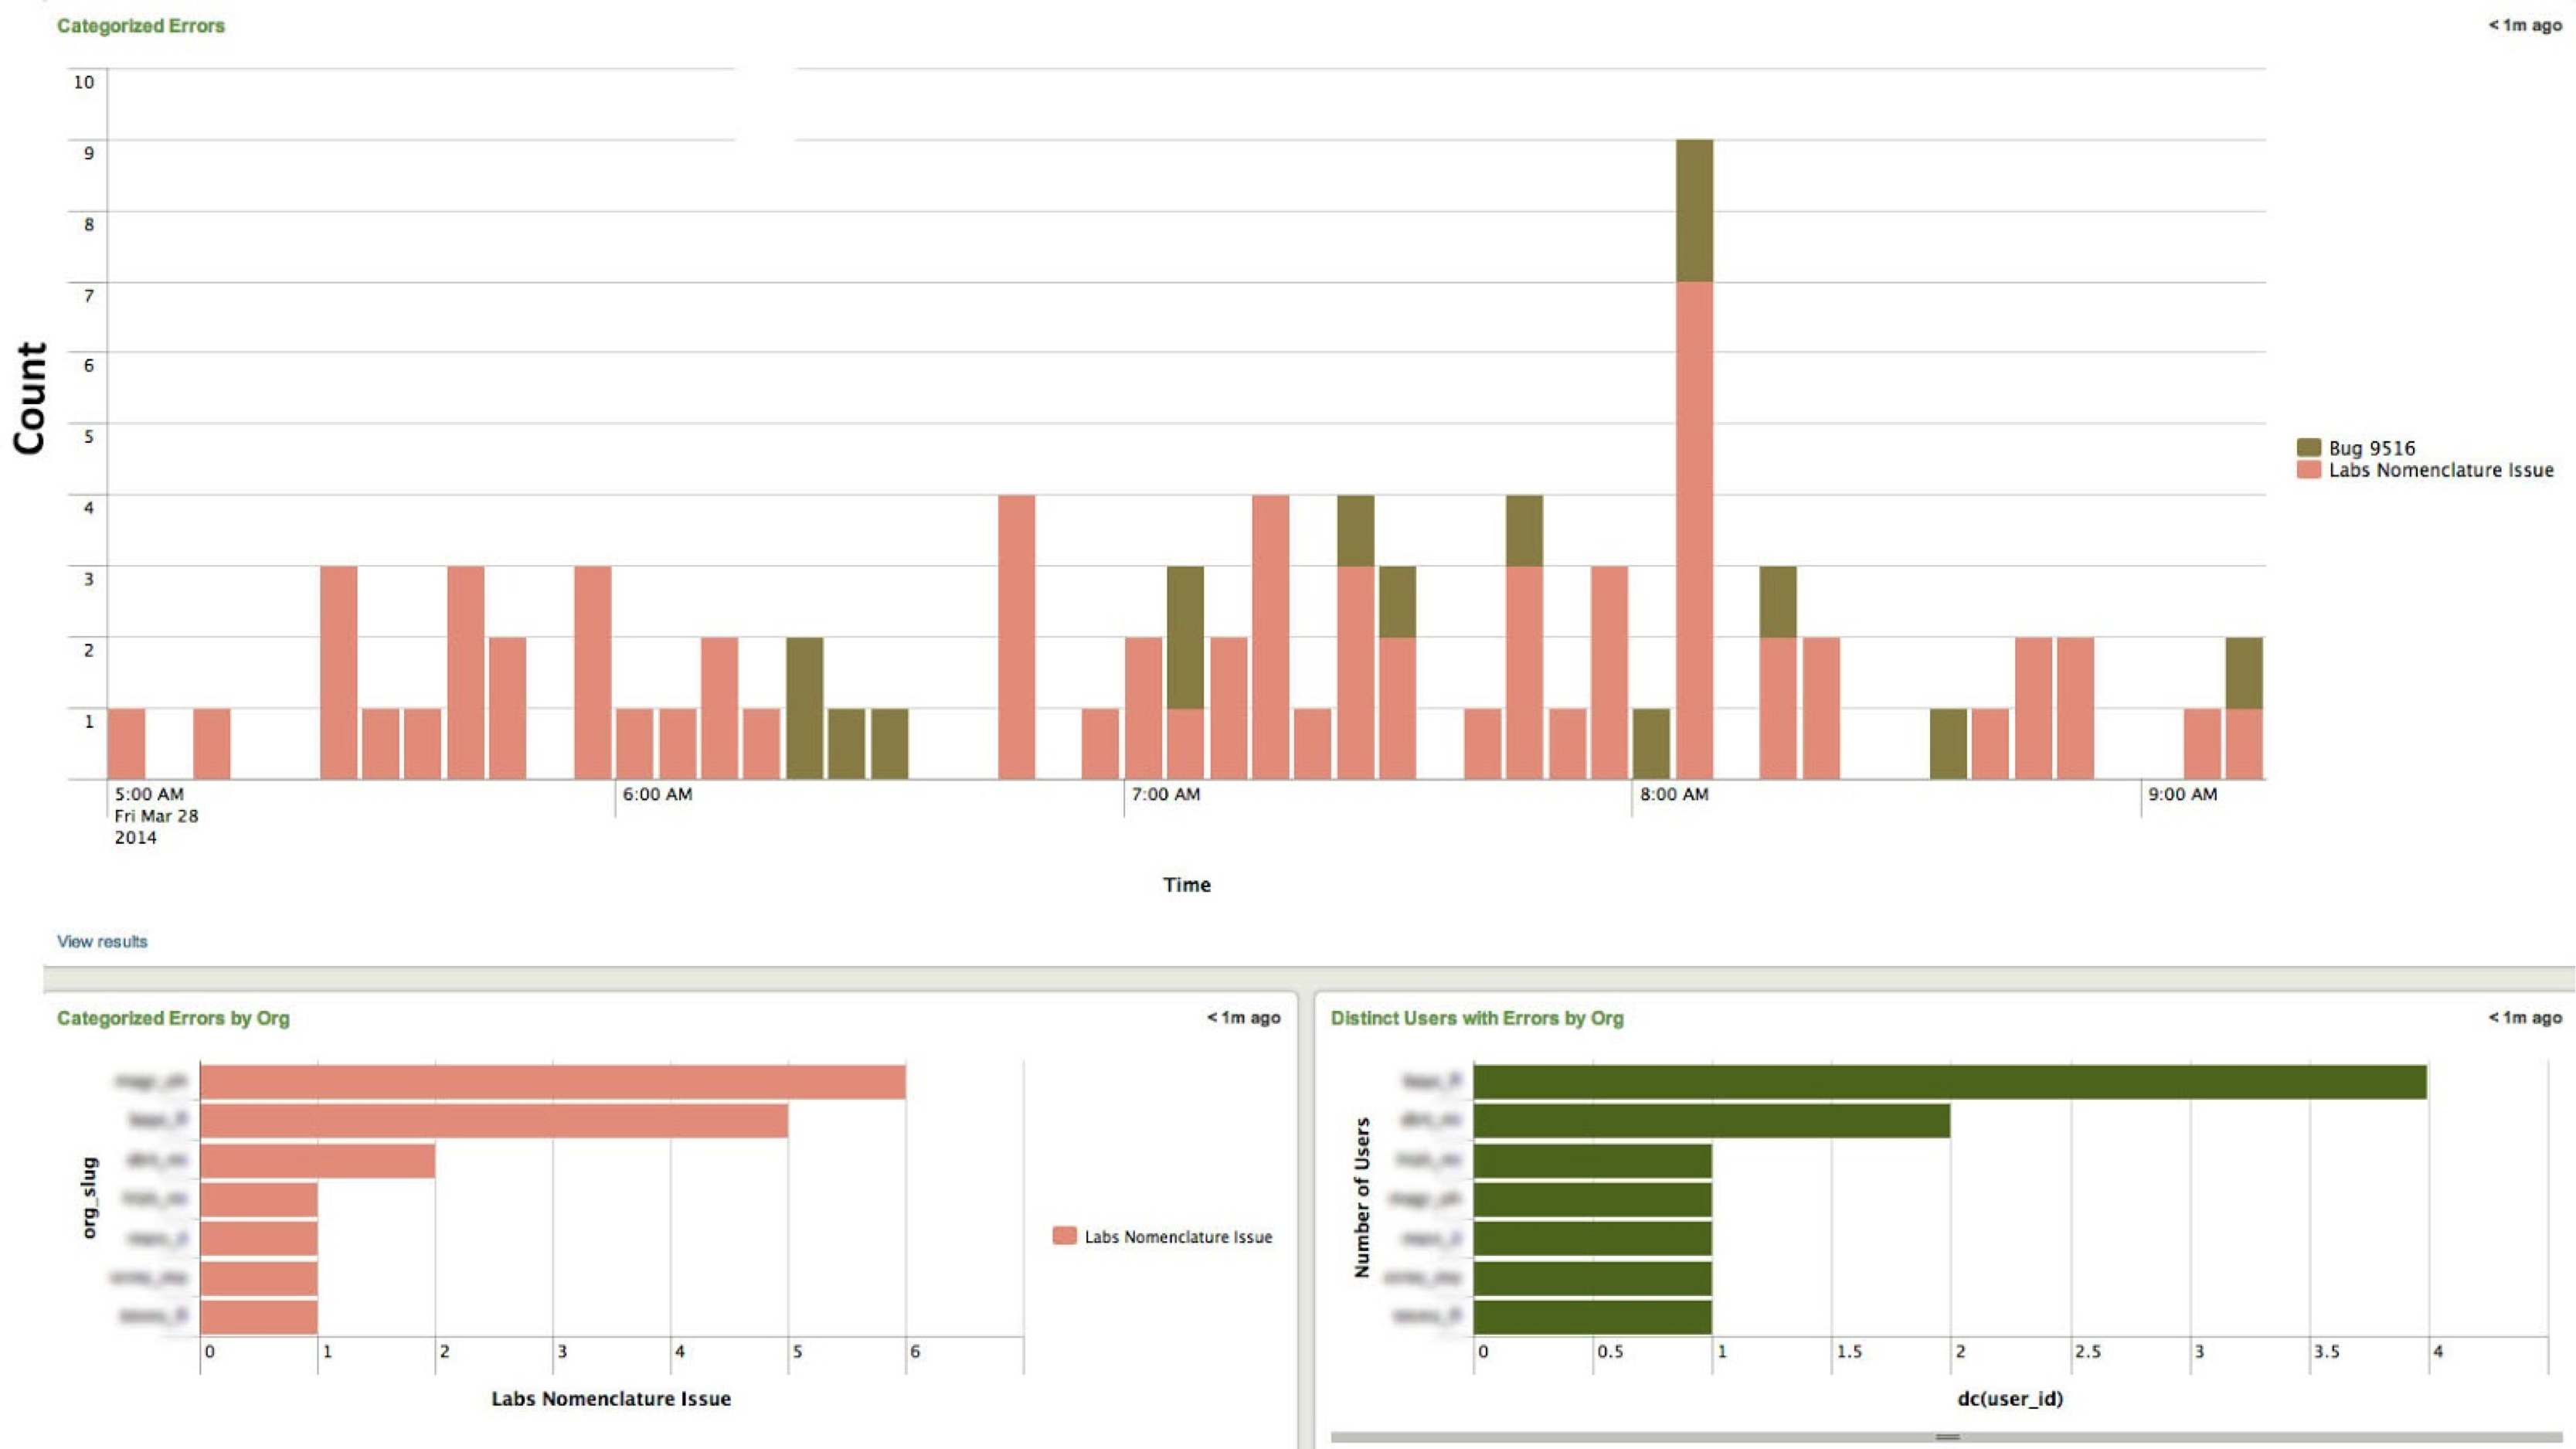
Once we migrated to Splunk we were very excited about the capabilities it offered, especially around searching and data visualization. In addition to searching logs more effectively, we were able to extract meaningful information from our logs unlike before. Splunk gave us the ability to identify client and end user impact down to the user id across all events in our logs [see image below]. This helped us gain more insight into our problems and trends in terms of impact to users. For a particular problem, we were able to quickly conclude whether all clients were affected, whether clients affected were over a virtual network only, and if the issue was isolated to a specific user. This information gave us the ability to determine the impact of issues coming into our logs, including the area of the site being impacted and frequency.
Below: Once we extracted meaningful fields in our logs, we could identify impact. In this case, an issue is spread across 9 orgs and and 28 users.
Although we had crossed some of the hurdles which made log monitoring difficult shortly after moving to Splunk, monitoring logs for issues was still not an easy job. It was possible to overlook issues since there was no effective way of studying trends. Initially, we created dashboards which helped identify organizations having problems. This was slightly useful but failed to depict more important graphical representation of the different types of occurring issues for a particular client or for all clients at a given time.
Below: Reports like these weren’t very helpful. Clients with more users tend to have more errors, so this trend doesn’t necessarily indicate a client is experiencing a downtime.
Splunk Round 2
It didn’t take us long to realize that we had to get a better handle on our logs to stay on top of increasing traffic caused by a growing user base. Although we were able to identify frequently occurring errors, we still needed a more effective way to identify known issues, service issues, configuration issues and application issues. In order to do that, we needed something more meaningful than a stack trace to track issues. We needed to tag events, and to do that, we turned to the eventtypes feature offered by Splunk.
Eventtypes are applied at search time and allow you to create events to tag search results with. Because they are applied at search time, we were able to add new event types and have them applied historically throughout our logs. This also gave us the ability to tweak our event types to add more known issues as we continued identifying them. Once we successfully gauged a way to take advantage of eventtypes, we came up with a query that created a stacked timechart of eventtypes where eventtypes represented known issues. Once we reached the improved level of production monitoring, the following had to be done:
- Create an eventtype with least priority that catches all problems and label it “Unknown Issue.”
- Go through “Unknown Issues" and create prioritized eventtypes that describe the problem in english. Once an issue is logged in our bug tracking system, tag the eventtype with that id for easy tracking.
- Repeat daily.
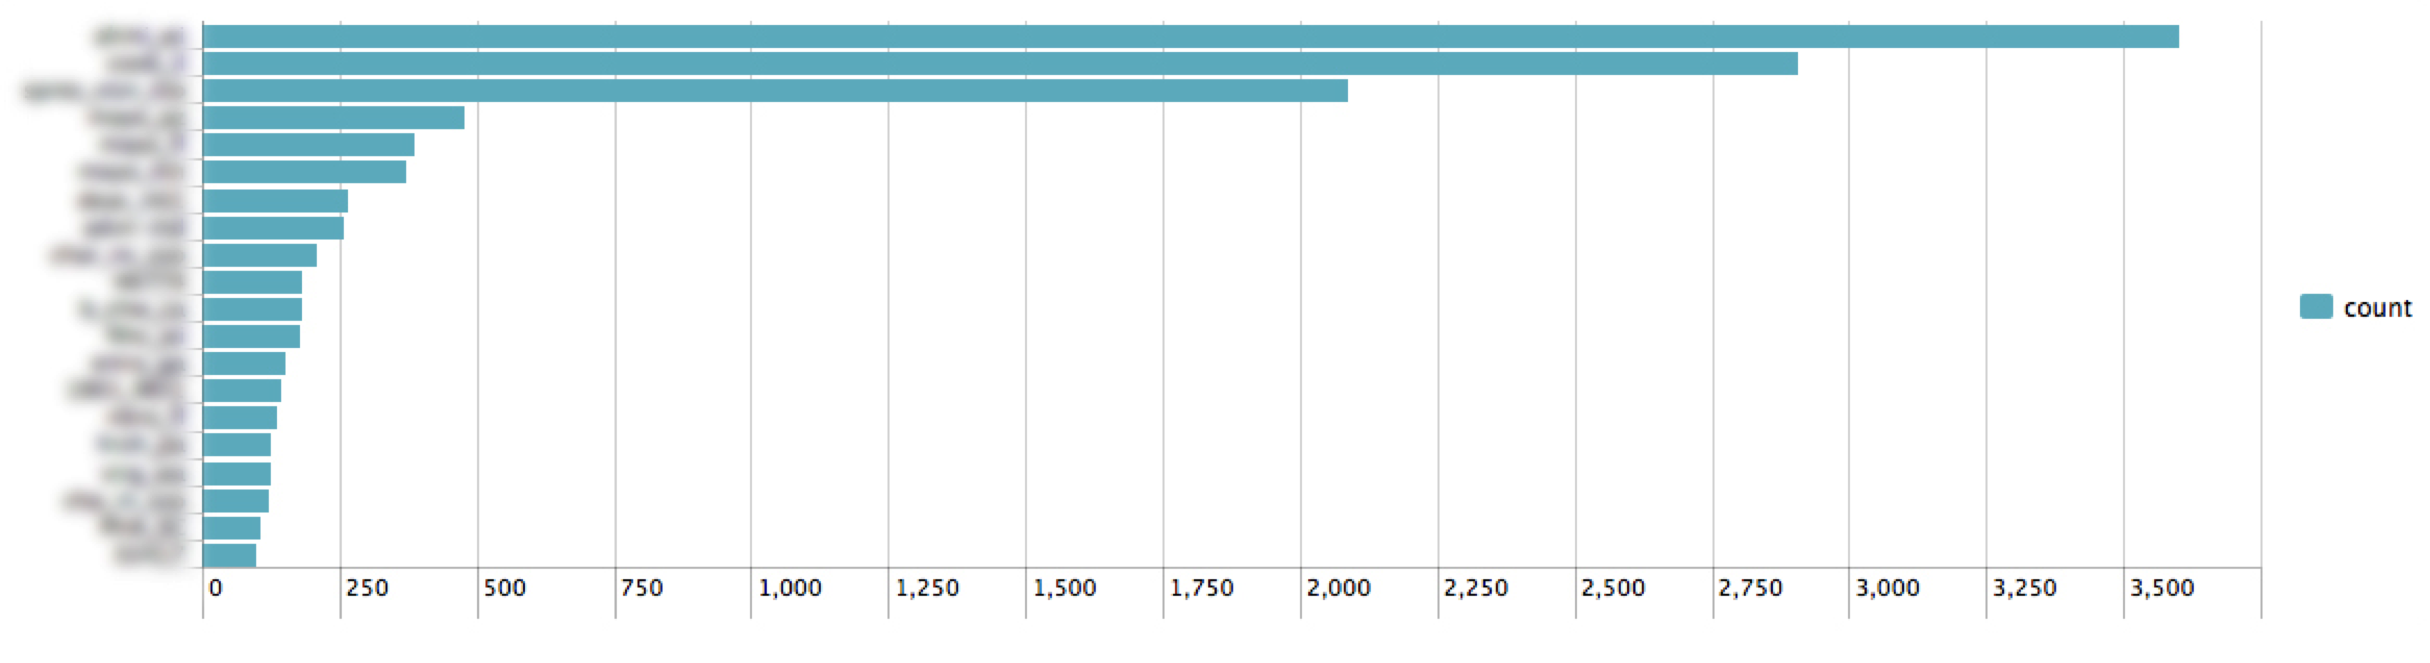
Below: Eventtypes give us the ability to see known problems that happen over time. We can even see known problems broken down by client.
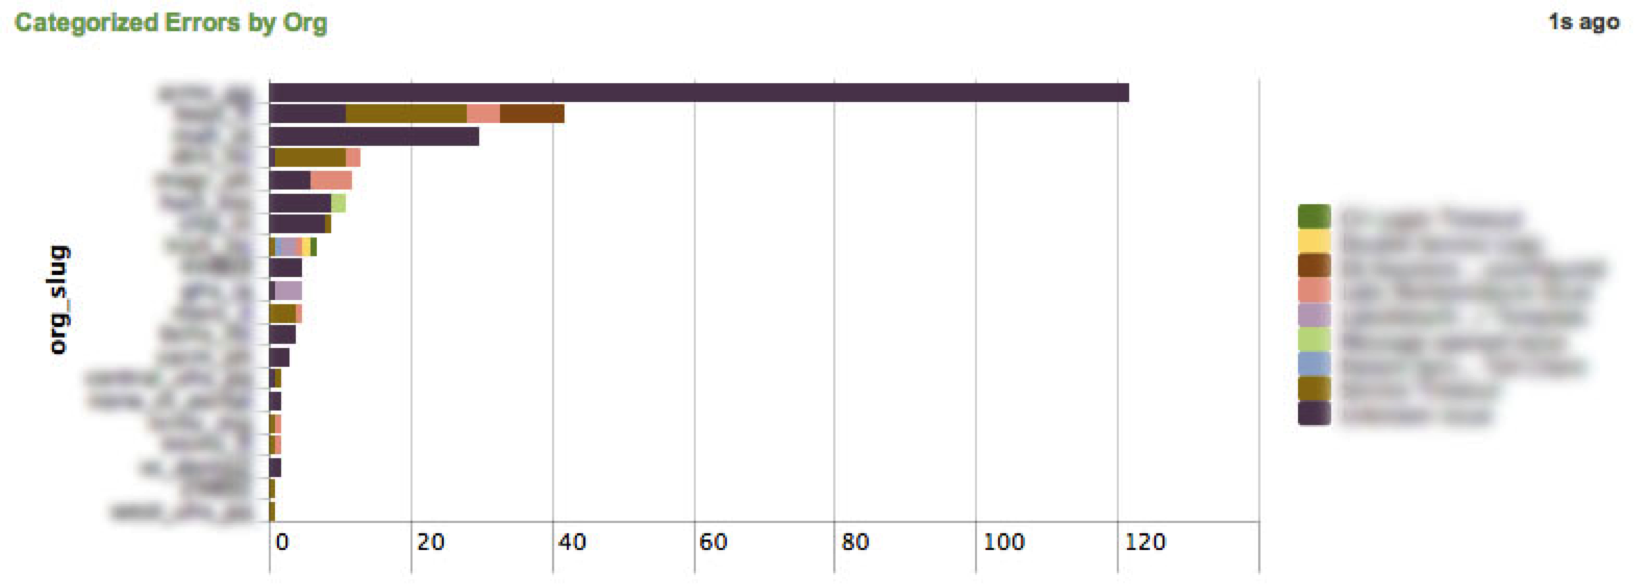
Once we had our frequently occurring problems categorized, we were able to break it down even further. We could identify problems caused by configuration in our application layer, problems that required escalation or if client side contacts needed to be engaged.
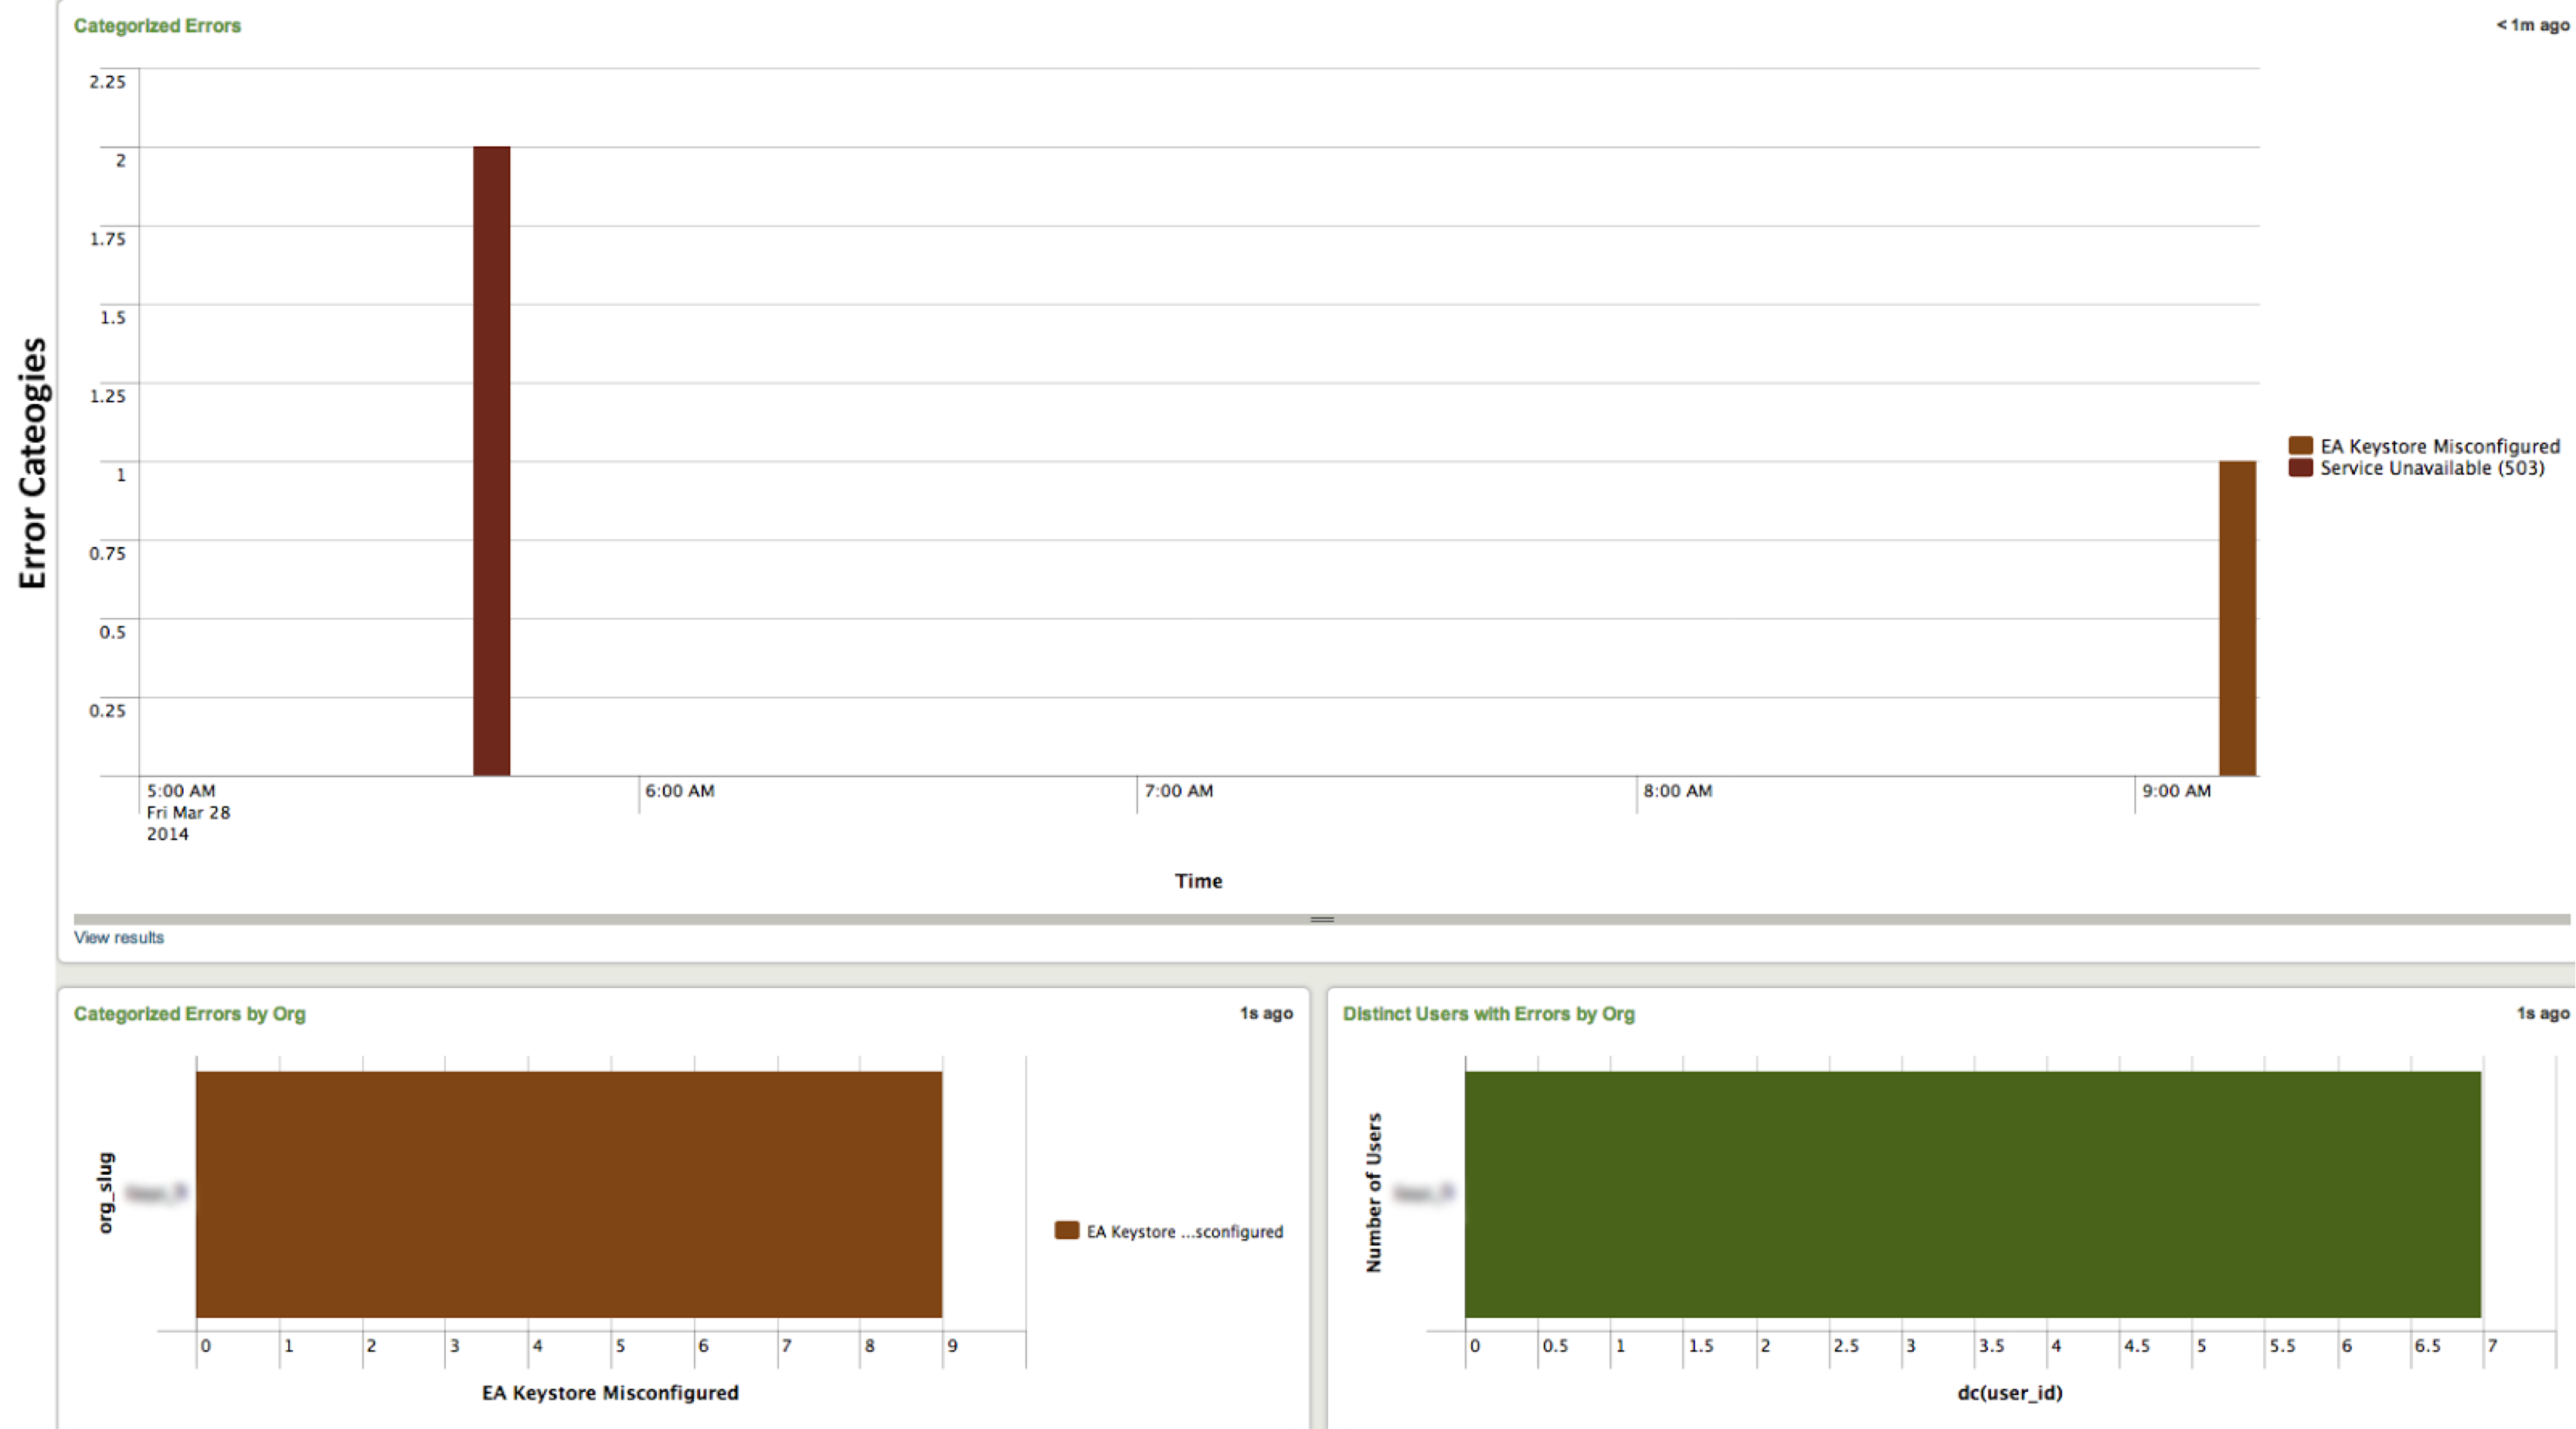
Below: We now have the ability to track impact to users from clients not taking a service package [left], or from improper Service Configuration [right].
Alerting
We’ve also started taking advantage of Splunk’s alerting. With its powerful searching abilities, we have scheduled searches that trigger an alert when a particular condition is met. For example, when a client has misconfigured certain credentials that cause authentication errors all over the site, we can engage support immediately to get it resolved.
What’s Next?
Although we have a better understanding of our logs now, it can get even better. We plan on continually categorizing our logs so that monitoring our system becomes really simple for everyone. Once all of our known issues are categorized, we wish to have a scheduled search that can identify anomalies in the logs. This would be highly beneficial to find out if a release introduces issues.
Since our site is dependent on multiple services, most of the service problems are resolved by escalated support. We are currently working on identifying problems with known resolutions along with the people that need to be contacted to perform the resolution steps. Eventually we would like to send alerts/emails from Splunk to Cerner’s general support directly for these issues.
We also plan on integrating Jira into splunk with the help of the Splunk Jira app. This will give us the ability to not only track issues in our logs, but also view their current status (investigation, assigned, fixed, resolved). This closes the loop on finding new issues, tracking their impact, and finally their resolution until the end. Splunk has been extremely exciting to work on and has been an invaluable asset to our team. We’d love to continue the conversations on how we can improve our usage of Splunk and how others are using it as well.